Stay on top of your connections and access performance with real-time Stats monitoring! 🚀
How can Stats help me? 📊
Welcome to Stats, your ultimate ally for business success! With its user-friendly interface, you can effortlessly monitor your performance and swiftly address any traffic or connection hiccups that may come your way. By offering valuable insights on a per-connection and per-method basis (Search, Quote, Book, Cancel, and Other), Stats grants you a comprehensive overview, along with detailed performance information.
Let Stats empower you with data-driven decisions and take your business to new heights! 📊🚀
How can I use Stats? 🔍
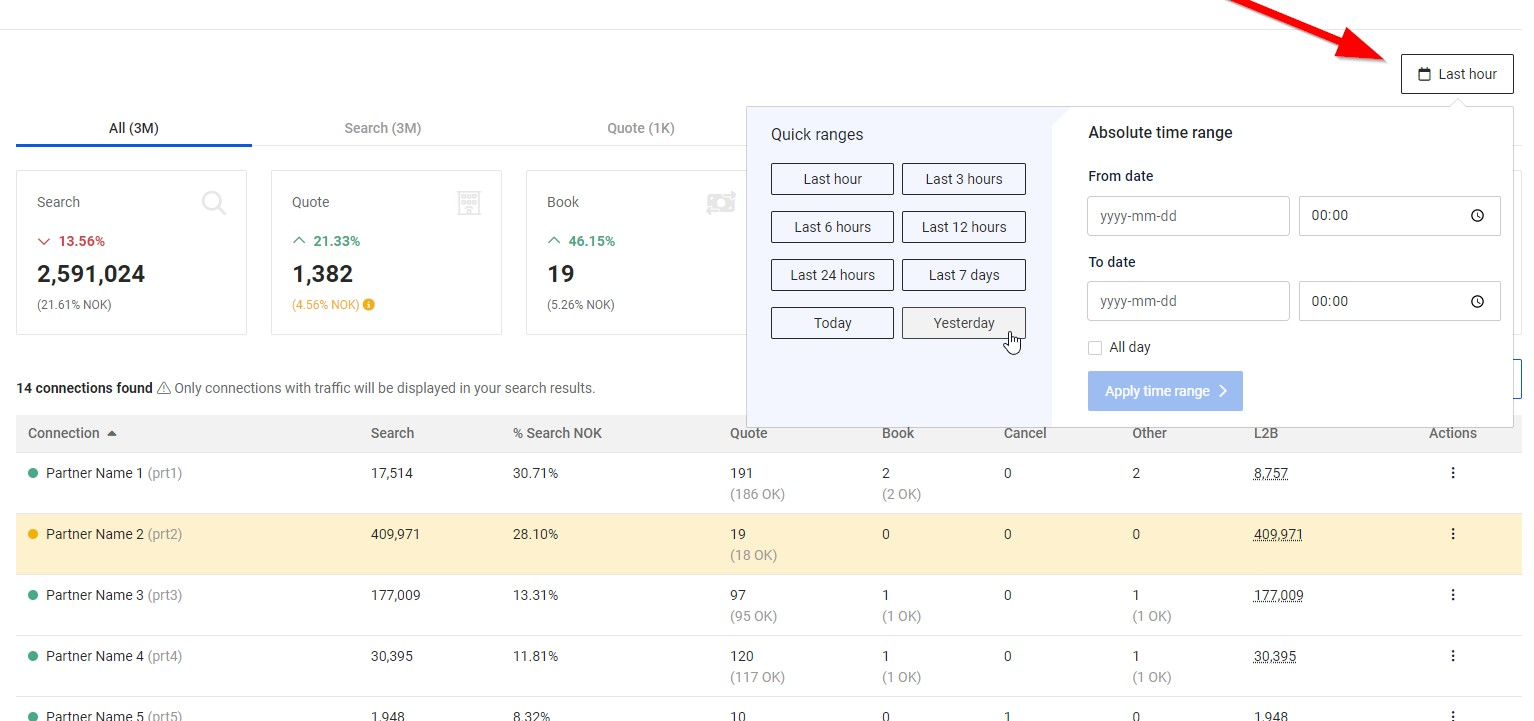
Once you're logged into TravelgateX, simply click on APPs and then select Stats. By default, you'll see your Organization's statistics for the last hour. But don't worry, you have the flexibility to adjust the time range as per your requirements using the convenient selector in the top right corner.
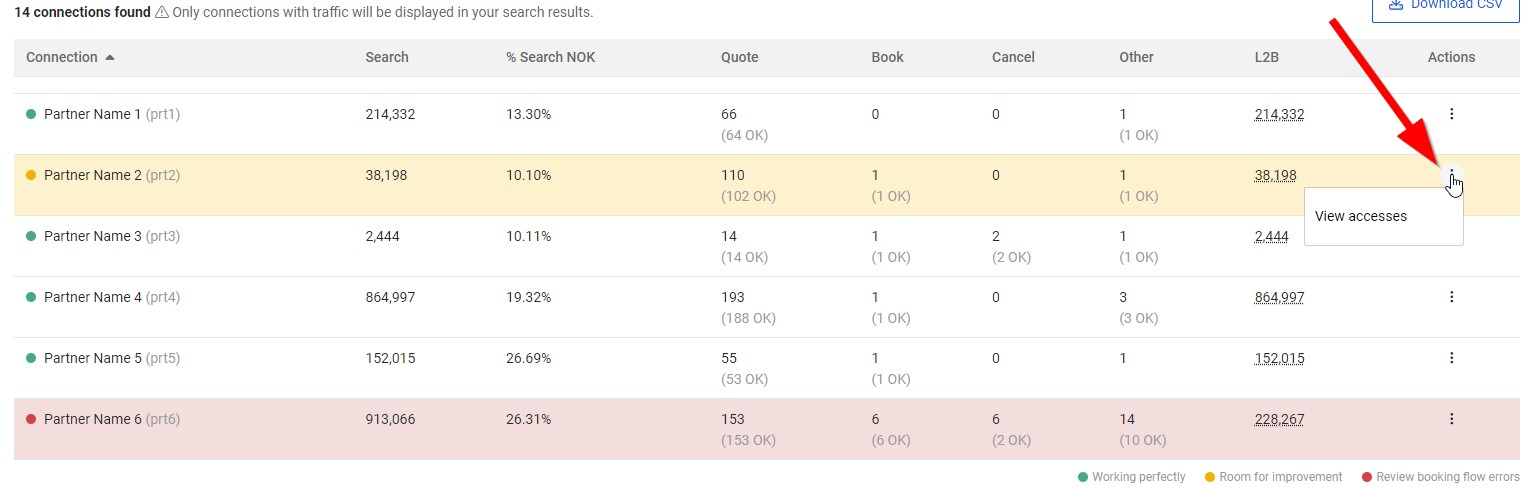
All the information you need is neatly arranged into different tabs. The first tab, "All," presents a comprehensive view of your Organization's entire booking flow, with key insights displayed through intuitive cards. For a deeper analysis, explore each connection in detail using the table below. And if you crave even more data, simply select the "View accesses" option for any connection to access detailed statistics at the access level.
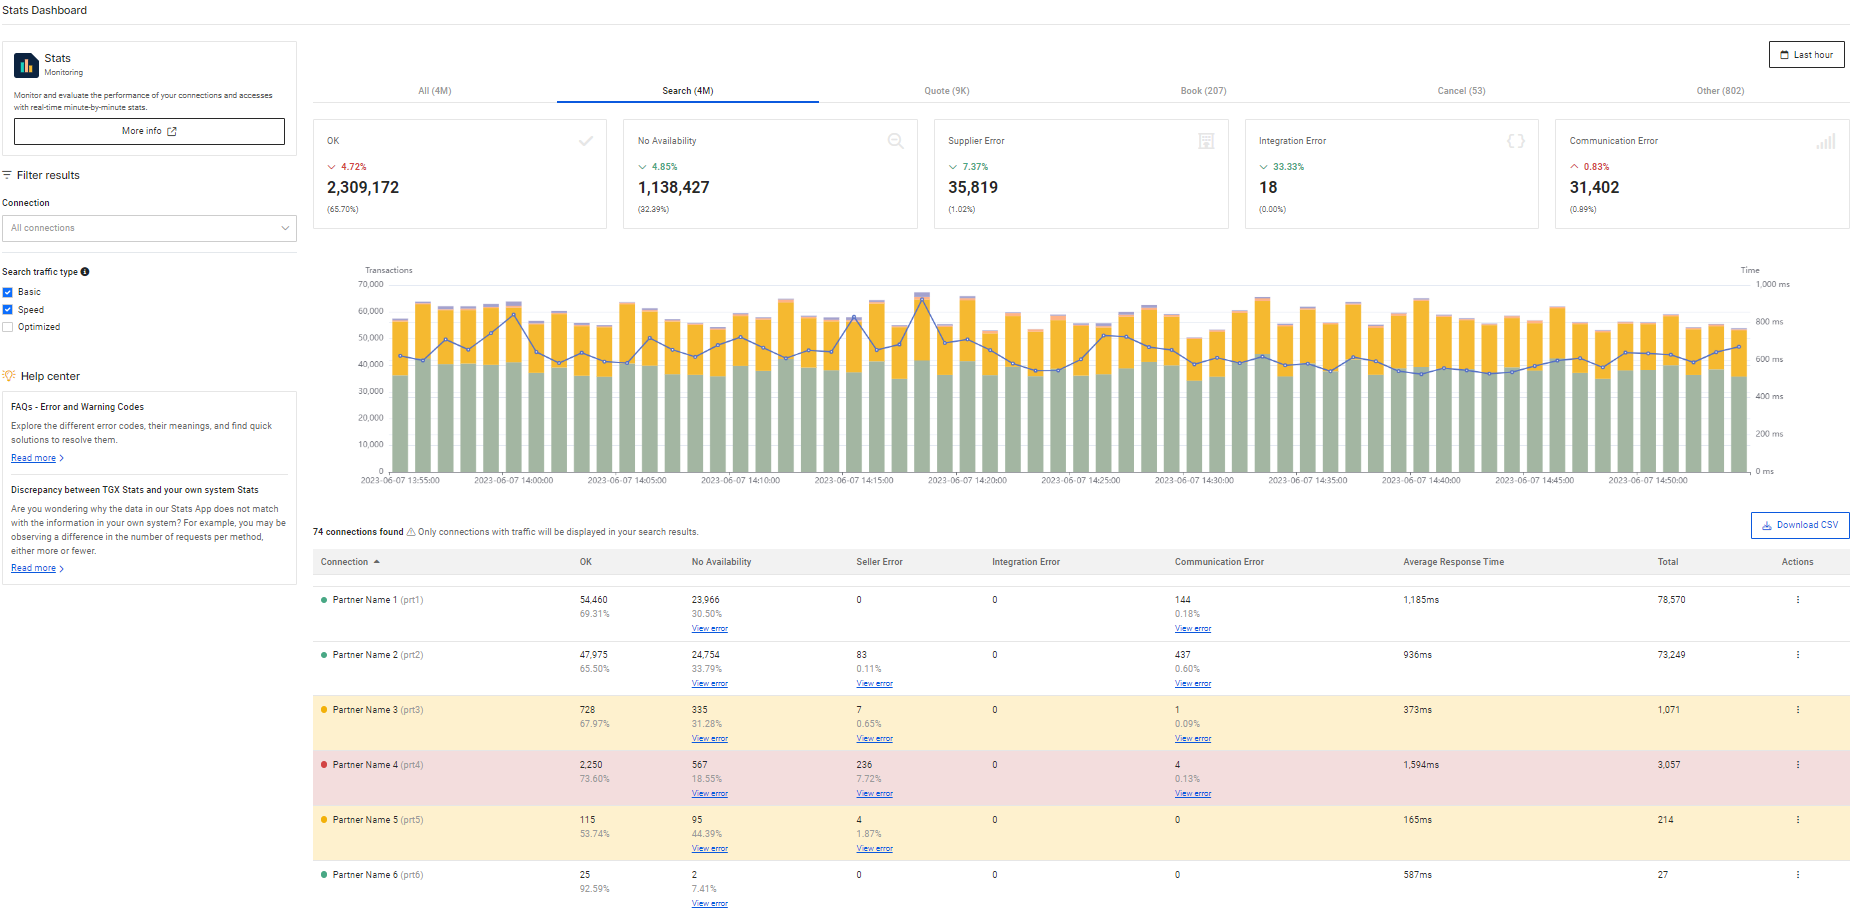
Delve into other tabs like "Search," "Quote," "Book," "Cancel" and "Other" for specific details about each booking step. These tabs offer more detailed insights, categorizing information based on different error types that may occur during each phase. Scorecards summarize data for your Organization as a whole, while tables display data for each connection. Additionally, a user-friendly temporal chart is provided to help you visualize traffic patterns over time.
With Stats, you can easily track:
- The total volume of requests for each booking flow step.
- The total volume and percentage of successful requests (OK).
- The total and percentage of errors categorized by error type.
- Average response times.
- L2B (Look To Book) ratio.
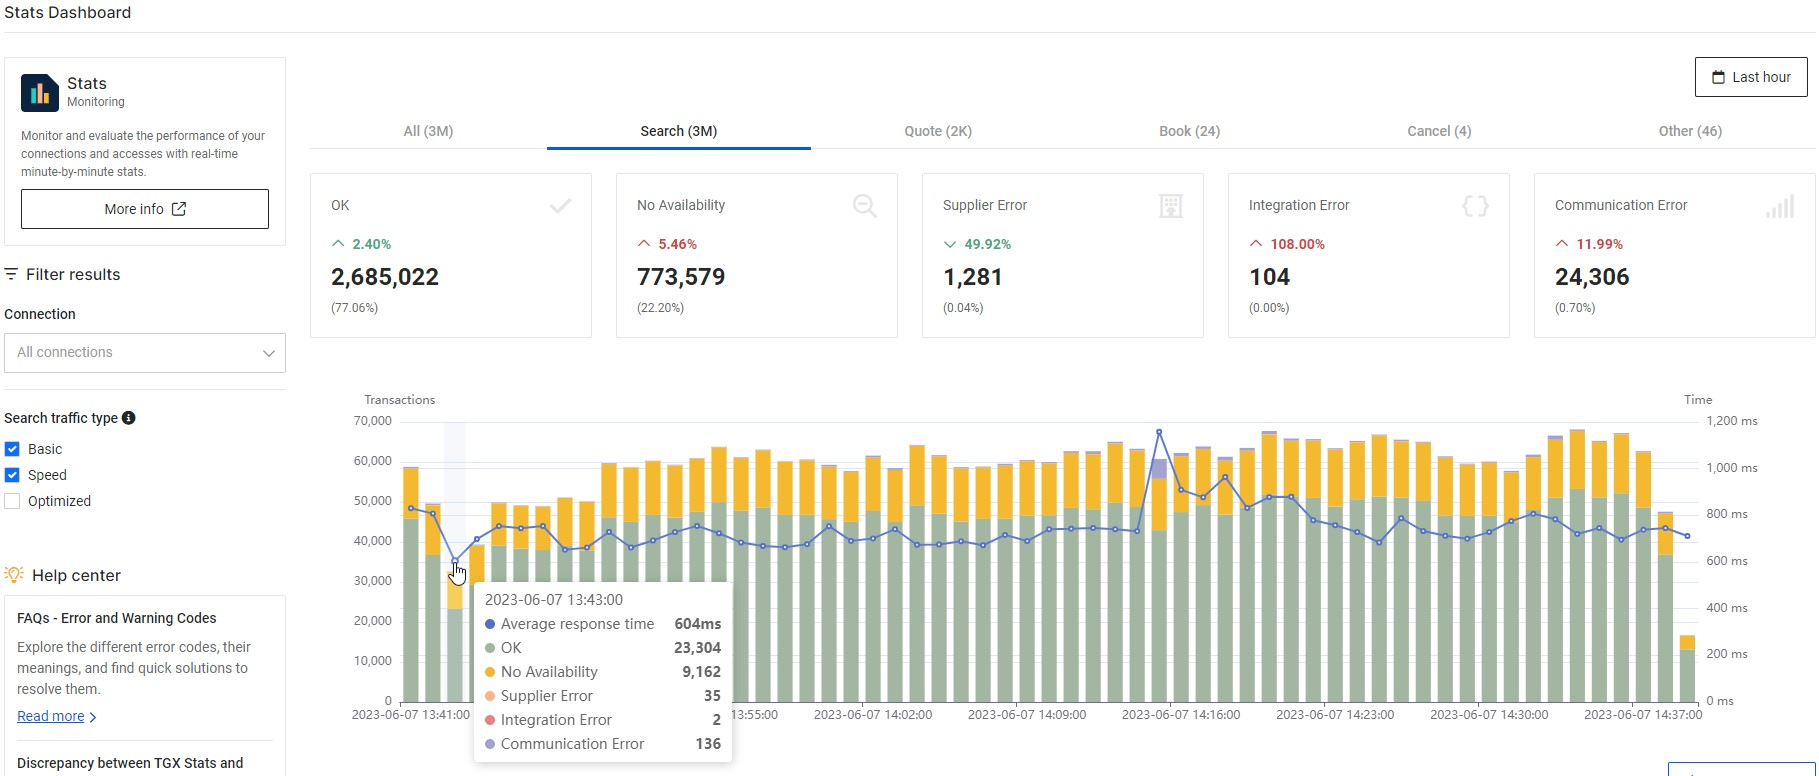
Additionally, in case any transactions encounter errors, fret not! You can easily identify the specific error code and even download the log transactions for the Quote, Book, and Cancel steps. Stats is here to empower you with all the information you need.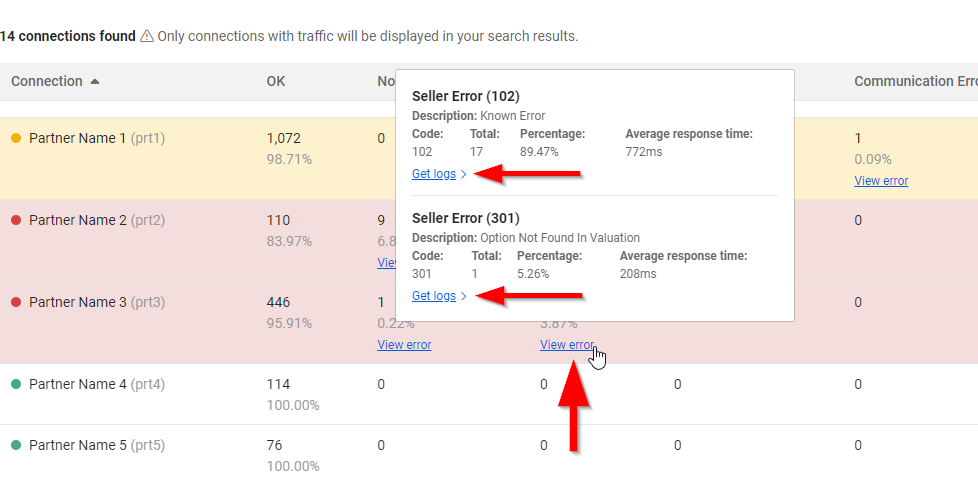
Understanding the colors in my connections: A Closer Look 🎨
You might have noticed that some of your connections sport a yellow or red background. Don't worry, we're here to provide you with a heads-up on their status. In our bustling Marketplace, where thousands of connections generate over 5 billion searches and more than 30,000 bookings each day, we have a wealth of data at our disposal. With this rich information, we can calculate the typical error ratios for each step of the booking flow, and we're thrilled to share those insights with you! 🌟📊
When a connection has no color, it means its error ratio is excellent, performing flawlessly in terms of performance. A yellow connection indicates it's working well, but there's potential for improvement. Fine-tuning some error ratios could make it even better. On the other hand, a red connection suggests the error ratio needs reviewing, as there may be errors that could be further reduced! Keep an eye on these indicators to ensure top-notch performance for your connections.
Each scorecard displays a percentage of NOK (not OK) transactions, along with an informative icon. Hover over the icon, and a tooltip will pop up, revealing the typical percentage these ratios should be below.
| Search NOK % | Quote NOK % | Book NOK % | Cancel NOK % | |
| Working perfectly ✅ | Less than 42.5% | Less than 4% | Less than 6.5% | Less than 6.5% |
| Room for improvement⚠️ | Between 42.5% and 70% | Between 4% and 10% | Between 6.5% and 13% | Between 6.5% and 13% |
| Review booking flow errors🔴 | Greater than 70% | Greater than 10% | Greater than 13% | Greater than 13% |
Discover a world of amazing APPs that can enhance your connections' performance, including the Traffic Optimizer and Speed. Take a moment to explore each one and uncover how they can boost your experience! 🚀💡
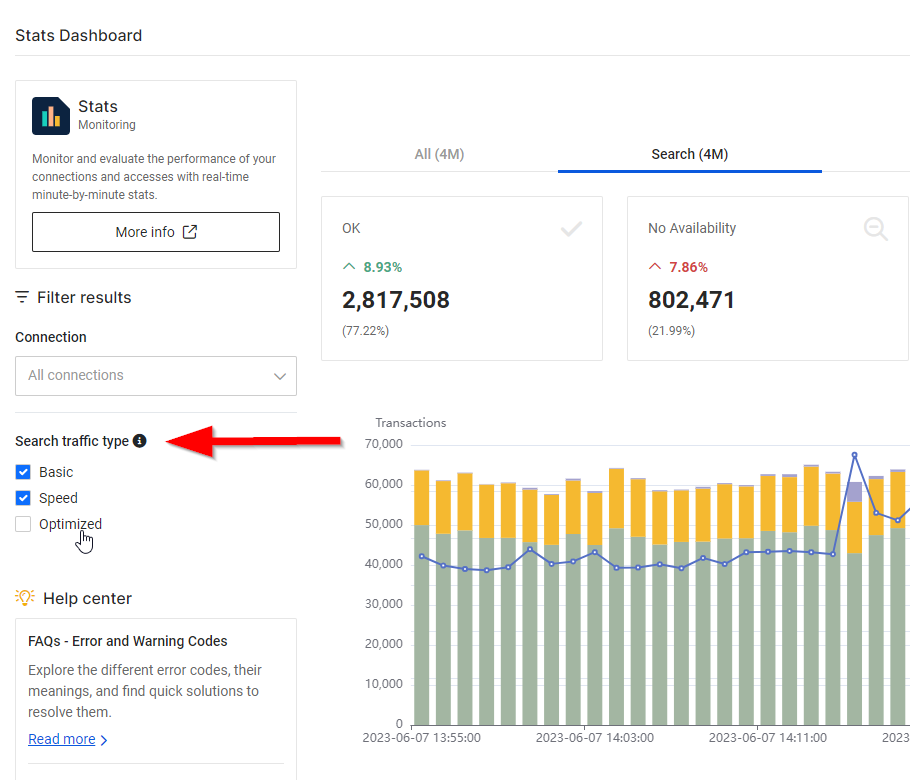
What does 'Search Traffic Type' refer to? 🔍
You might have noticed a handy feature in the Search tab known as the "Search Traffic Type" filter. This filter comes into play when you're using our Speed Cache APP. By default, traffic flows directly from the Buyer to the Seller systems, which we refer to as "Basic" traffic. However, when Speed is activated for a specific connection, the traffic is split into two types: the traffic that the Buyer sends and the Speed cache handles, and the traffic that Speed sends to the Seller system to fill its cache.
To help you visualize these different traffic types, we created the diagram below:

- BASIC (Blue): It is the standard transaction. A Buyer is connected to a Seller without any other solution to the connection.
- SPEED (Green): It is the transaction sent by a Buyer when their connection uses Speed. Our cache solution blocks the request from reaching the Seller's system.
- SCHEDULER (Red): This kind of transaction only refers to static content (Hotel List, Hotel Information, etc). A transaction is tagged as "Scheduler" when the information requested is stored in TravelgateX Database (Offline).
- OPTIMIZED (Gray): These are the requests sent by TravelgateX to feed our internal databases. There are two sources:
- Speed: When the information requested by the Buyer in a Speed connection is not already stored in our DB. TravelgateX sends a request to the Seller to obtain it.
- Scheduler: When the time it takes to get all the static information from a Seller is too high, TravelgateX downloads it asynchronously in order to return it to their Buyers in a shorter, more acceptable time frame.
By default, Stats displays the combined traffic sent by the Buyer, regardless of whether it is handled by the Seller (Basic Traffic) or the Speed cache (Speed Traffic). However, if you're interested in viewing only the traffic that the Seller system actively manages, you can use the filter and select the 'Optimize' + 'Basic' options: